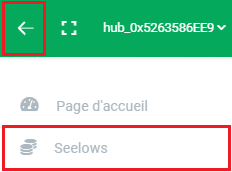
To access the Seelow page
Log onto your Agrimesh console, from the hamburger menu to the far left of the green ribbon, select the “Seelows” option. A selection of your Seelows will be displayed. Click on the one you wish to see the details for. Let’s see what kind of information there is on this page.

The Seelow details
In the upper section is the present information about the Seelow. Starting from the left, the image gives a visual approximation of the amount of feed in the bin. Moving to the right, above the Seelow name, the blue cog lets you configure or modify your Seelow. Underneath the name (in the red rectangle), we have some technical information.
- The hexadecimal number starting with 0x is the device serial number.
- The little clock increments once every second. It represents the last time a signal was sent to the Hub. Although the timer should stay under two minutes, going past is usually not a big deal since the feed in the bin moves fairly slowly.
- Next is the quality of the last signal sent from the Seelow to the Hub, in decibels. A perfect signal is -40 db. The worst signals we observe are around -90 db. Going below -80 db may be problematic if you see the previously described timer go over 3 or 4 minutes frequently. In this case, you can review your installation or contact our support.
- Then we have the battery voltage. This one should usually stay over 4.10V as it will recharge with solar power. A battery below 3.50V is not expected to work anymore.
- Finally, the downward and upward arrows represent the last maximum and minimum measurements taken, respectively. This one is a little technical: before sending the measured distance to the Hub, the laser takes a series of measurements and the minimum and maximum are recorded and displayed there. These values should be fairly close to each other.
The refresh button will trigger the door on the Seelow to open and refresh the measurements.

The information in the green rectangles is more straightforward. From left to right, we have
- the weekly consumption,
- the consumption in the last 24 hours,
- the date and the amount of the last refill,
- and the number of days before the bin is expected to be empty.
Below are charts for consumption per day, the consumption in the last 24 hours, then the weekly and monthly consumption. Last is the detailed information for the last month. CSV files are available for all your charts.
See also:

